Ideas for a Better World newsletter
UK Growth: Boring Wins
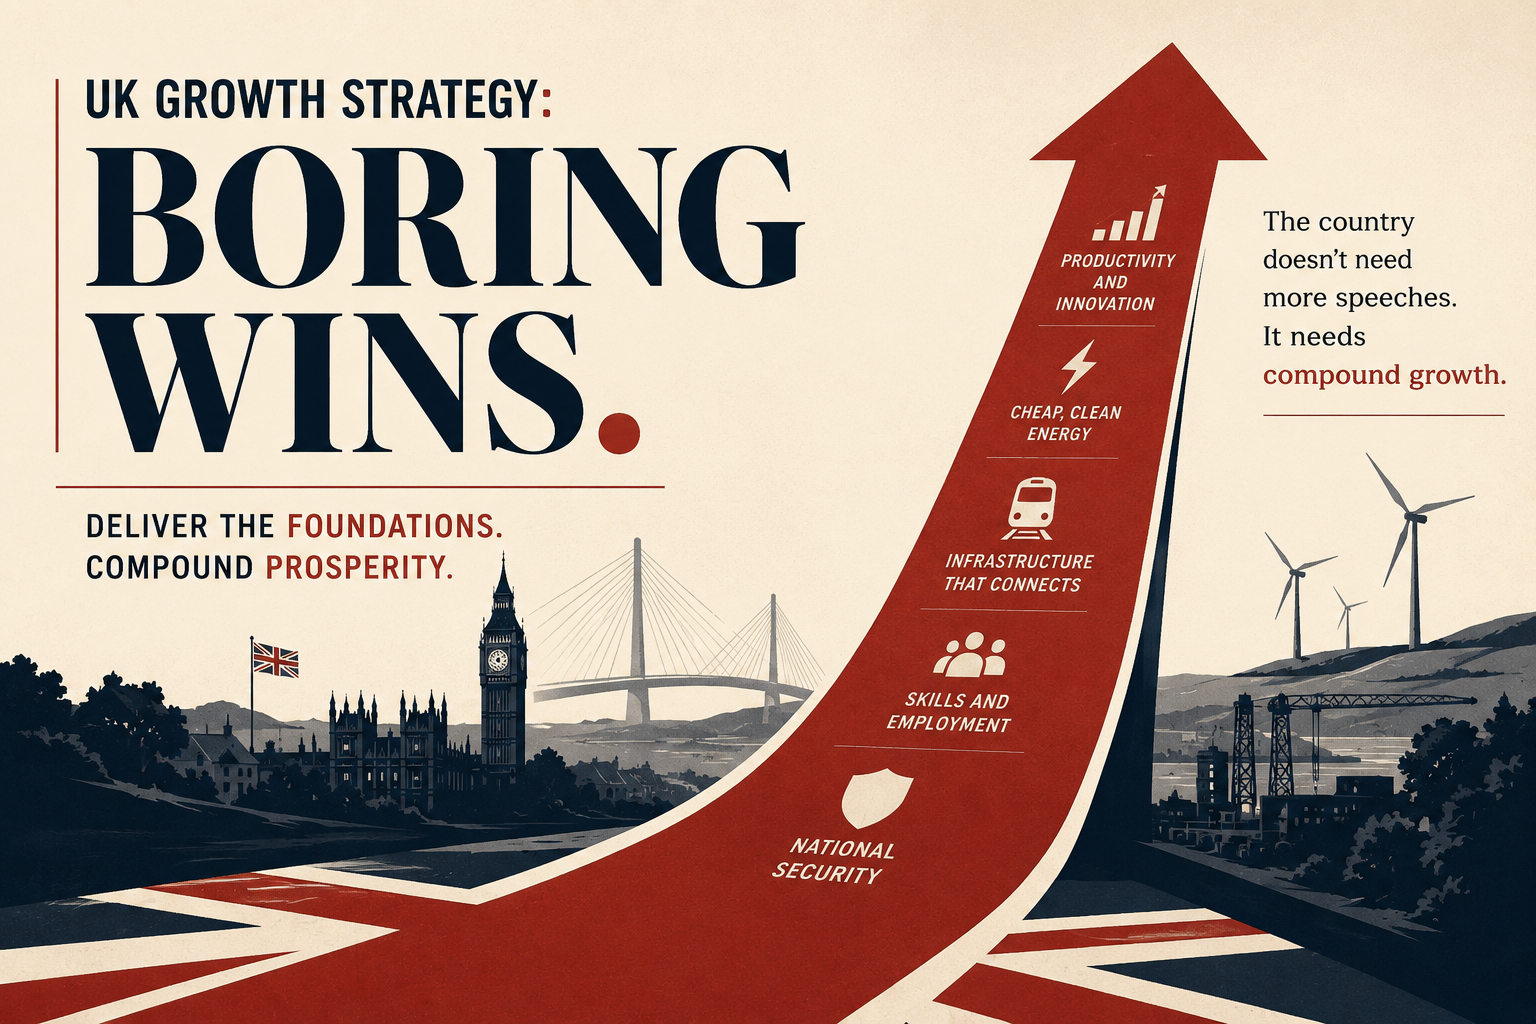
Britain has had the lowest investment rate in the G7 for 24 of the last 30 years. The last time it sat at the group's median was 1990, the year the Berlin Wall came down. That single fact does most of the explanatory work for everything that has gone wrong with the British economy since the financial crisis. In the third quarter of 2025, gross fixed capital formation in Britain ran at 18.6% of GDP, the lowest of any country in the G7. Had it merely hovered at the G7 median over the intervening decades, the IPPR estimates the country would have attracted an additional £1.9 trillion of real-terms investment.
The compounding cost shows up in productivity. Labour productivity grew at roughly 2% a year before 2008 and averages around 0.5% a year since. EY calculates that, had the pre-crisis trend held, output per hour would now be over a third higher than it actually is. British workers operate with around 38% less capital per hour than peers in France, Germany, the Netherlands and the United States. In manufacturing the gap is closer to 47%. Workers without machines, software, buildings and intellectual property to work alongside cannot produce as much.
The other constraints are familiar. Britain's planning system throttles housing, lab space, grid connections and water (no new reservoir for over two decades). Industrial electricity is the most expensive in the International Energy Agency, with medium users paying around 92% above the EU median in the first half of 2025. The post-Brexit trading arrangement, in the OBR's central estimate, reduces long-run productivity by 4% relative to remaining in the EU, with roughly two-fifths of that hit already absorbed by 2025. None of this is mysterious. What is missing is a sustained, sequenced programme to do something about it.
What follows is that programme. The numbers attached to each reform are independent estimates, mostly from the Office for Budget Responsibility, the OECD or peer-reviewed empirical studies. They are not strictly additive — there is overlap between them — but they describe the order of magnitude of what is on the table.
The plays that work
Liberalise planning, end-to-end
Do.Pass the Planning and Infrastructure Bill in full. Extend NPPF reform beyond housing to lab space, grid connections, water, transport and energy infrastructure. Bind local plans to housing targets with no opt-outs. Use the Nationally Significant Infrastructure Projects regime more aggressively.
Expect.+0.4% of GDP (~£10–15bn a year) by the mid-2030s. Planning and Infrastructure Bill adds a central £3.2bn over a decade. Zero fiscal cost.
The OBR has called the planning reforms "the largest positive real GDP effect we have ever reflected in a forecast for a policy with no fiscal cost". International evidence suggests the numbers are conservative. Auckland upzoned roughly three-quarters of its residential land in a single 2016 reform; peer-reviewed studies in the Journal of Urban Economics find that housing construction roughly doubled in upzoned areas relative to controls, while rents over the following six years rose 20%, well below comparable New Zealand cities. The UK reforms to date are smaller in scope than Auckland's; the upside if they are extended is correspondingly larger.
Deepen Britain's capital stock
Do.Make full expensing permanent and extend it to intangibles. Accelerate the Mansion House compact to channel UK pension fund capital into domestic growth equity. Publish and stick to a 10-year infrastructure pipeline. Reform public procurement to favour SMEs and innovators rather than incumbents.
Expect.Closing the 38% capital intensity gap over 15–20 years would close most of Britain's 20% labour productivity gap with the United States.
Corporation tax is not the binding constraint. The headline rate fell from 30% in 2007 to 19% in 2017 without a corresponding lift in business investment; Britain still ranks 28th of 31 OECD economies on business investment as a share of GDP. What matters is stability, full and permanent capital allowances, deeper domestic growth equity, and predictable demand signals from infrastructure and procurement. None of this is a tax cut. Most of it costs something in the short run and pays back over 10–15 years.
Rewire industrial electricity
Do.Reform the marginal pricing structure that allows gas-fired generation to set wholesale electricity prices when renewables are abundant on the system. Move policy levies (renewables subsidies, grid balancing costs) off electricity bills and onto general taxation. Introduce an ARENH-style mechanism that fixes industrial electricity prices for strategic sectors to the cheaper of French or German rates.
Expect.Multi-billion annual cost reduction for energy-intensive manufacturers. The larger prize: Britain becomes viable for the energy-intensive industries of the next decade, AI infrastructure foremost.
UK Steel calculates that British steelmakers paid £845m more for electricity than French competitors and £721m more than German ones since 2016–17, in a single sector. Across all energy-intensive industry the cumulative cost is larger. Britain currently sits at the bottom of the IEA league table for industrial electricity prices, with medium users paying 89–92% above the EU median, while industrial gas prices are 28% below the EU average. The disparity is policy-made and policy-fixable. It is not a problem renewables alone solve; it is a problem of market design, network costs and stacked levies.
The plays that are contested
Negotiate a partial EU reset
Do.Pursue a veterinary/SPS agreement to reopen agri-food trade, mutual recognition of professional qualifications, a youth mobility scheme, and re-association with the Horizon research framework on better terms. No single market or customs union return.
Expect.+0.5–1.0% GDP over a decade. Recovers up to a quarter of the OBR's central 4% Brexit productivity drag.
This is contested less on whether it would work than on whether it is politically deliverable. The OBR's 4% figure is broadly accepted by the empirical literature; the dissenting view from the Institute of Economic Affairs and Briefings for Britain is a minority position. The size of the available upside depends on how far the next government is prepared to go before the political cost outweighs the economic return.
Reshape rather than enlarge the tax base
Do.Shift the marginal burden from labour and transactions (employer NI, stamp duty) towards consumption and land. Remove the cliff edges that produce effective marginal tax rates above 60% in the £100,000–£125,000 band and at the high-income child benefit charge. Simplify allowances. Align capital with labour taxation over time.
Expect.Material reduction in deadweight loss, estimated by the IFS in low single-digit percentage points of GDP. Removes the worst cliff edges that suppress labour supply at the top of the income distribution.
Industrial strategy sits in the same contested bucket and resists a single recommendation. Britain has oscillated between horizontal policy (good rules, neutral tax) and concentrated bets (life sciences, AI, advanced manufacturing) for forty years. The oscillation itself is the bigger problem than the choice. Either approach is a plausible play; neither survives the next reshuffle.
A note on the North Sea
Real money, wrong stage.
The claim that licensing reform in the North Sea is a meaningful growth lever does political work, not economic work. The basin has been in geological decline since 1999. Production has fallen from a peak of around 4.4 million barrels of oil equivalent per day to roughly 1.3 million today. No politically realistic licensing regime restores anything close to peak output. The actual policy variable is fiscal: Offshore Energies UK estimates that reforming the Energy Profits Levy in 2026 rather than 2030 could raise tax receipts by between £15.7bn and £48.6bn over a decade and slow the rate of decline. That is real money for the Exchequer and for Aberdeen, and it is reasonable on its own terms. It is not a productivity lever and it does not move the dial on the questions that actually matter for British growth. Treating it as a flagship strategy, on either side of the argument, mistakes a regional fiscal question for a national economic one.
The fiscal floor
These reforms are given urgency by the country's debt service arithmetic. The OBR expects net interest payments on the national debt to total £111bn in 2025-26, around 3.7% of national income and 8.3% of all public spending. That is the highest debt service ratio in over four decades and almost twice the schools budget for England. Every additional percentage point on the average gilt yield costs the Treasury around £12bn a year by the end of the OBR's forecast. Public sector net debt sits at 94.5% of GDP, a level last seen in the early 1960s.
The September 2022 episode, in which thirty-year gilt yields rose 120 basis points in three days and the Bank of England was forced into £19bn of emergency gilt purchases to stabilise pension fund collateral calls, illustrated the speed at which market confidence can move. CEPR analysis published in October 2024 attributes less than a quarter of that yield rise to the unfunded element of the mini-budget itself, with global rate moves and Bank of England decisions accounting for the rest, but the episode now sits in the gilt market's institutional memory. The lesson is not that deficits must hit any specific number. It is that growth-enabling reform is impossible from a fiscal position the bond market does not trust, and that debt service at the current level is already crowding out the productive public investment Britain needs.
Play Expected impact Timeframe Fiscal cost 1. Liberalise planning, end-to-end +0.4% GDP (£10–15bn p.a.) 5–10 years Zero 2. Deepen Britain's capital stock Closes most of the 20% productivity gap 15–20 years Medium; multi-year paybacks 3. Rewire industrial electricity Multi-£bn p.a. industrial cost cut; AI-ready 3–7 years Mostly redistributive 4. Partial EU reset +0.5–1.0% GDP 5–10 years Minimal 5. Reshape the tax base Material deadweight loss reduction 10–15 years Revenue-neutral if designed well
Why this is not happening
None of the plays above is technically difficult. None is contested by mainstream economic analysis in the way the political conversation implies. In combination they cost somewhere between very little and a multi-year capital programme with a clear payback. Three of them are essentially free.
What they share is that each requires the British state to do the same thing, in the same direction, for a sustained period. Planning reform takes years to feed through to housing completions and decades to feed through to land prices. Capital deepening compounds over a generation. Energy market reform requires holding the line against incumbent interests for two parliaments. A Brexit reset and tax-base reform both demand political capital that governments prefer to spend on visible, near-term wins.
The British political system, with its short cycles, frequent reshuffles and rotating industrial strategies, is institutionally biased against this kind of patience. The cost of that bias is now visible in the fiscal arithmetic. Britain spends more on debt interest than on schools. The productivity gap with peer economies has reached 20–30%. Each year of delay compounds the constraint on the public investment any plausible recovery requires.
The playbook is sitting on the shelf. It has been read out at conferences, costed by the Treasury, certified by the OBR and demonstrated empirically in other countries.
Britain knows what to do.
So far, no government has chosen to do it.
Sources
ONS, Business investment Q3 2025 (Dec 2025): UK GFCF 18.6% GDP, lowest in G7.
IPPR, UK business investment second lowest in G7 (Apr 2026): 38% capital gap; 47% manufacturing gap; £354bn cumulative private-investment shortfall.
IPPR (2024): UK lowest investment rate in G7 for 24 of last 30 years; £1.9 trillion cumulative gap; last at G7 median in 1990.
House of Commons Library, Productivity: Economic Indicators (Q3 2025): pre-2008 ~2% p.a., post-2008 ~0.5% p.a.; UK ~20% below US on GDP per hour.
EY, Mind the productivity gap (Aug 2025): output per hour over a third below pre-crisis trend.
LSE Programme on Innovation and Diffusion (2023): most of the UK productivity gap with peers attributable to capital and skills underinvestment.
HMT/OBR, Spring Statement 2025: NPPF reforms +0.2% GDP by 2029-30 (£6.8bn), +0.4% by 2034-35.
DESNZ/Gov.uk, Planning and Infrastructure Bill Impact Assessment (May 2025): central NPV £3.2bn over 10 years.
Greenaway-McGrevy et al., University of Auckland / Journal of Urban Economics (2023-25): Auckland upzoning roughly doubled construction in upzoned areas; rents +20% vs much higher in comparator cities.
House of Commons Library / Ofgem (Feb 2026): UK industrial electricity ~92% above EU median for medium users; gas ~28% below EU average; highest IEA industrial electricity prices.
UK Steel (Sept 2025): UK steelmakers paid £845m more than French and £721m more than German competitors since 2016-17.
OBR, Brexit analysis (March 2024 reaffirmation): TCA reduces long-run productivity 4% vs Remain; ~2.7% GDP hit by 2025.
Centre for European Reform, Springford (June 2025): partial reset upside 0.5-1.0% GDP over a decade.
IFS, TaxLab (various): deadweight loss estimates from current UK tax structure.
OBR, Public finances brief guide (Jan 2026): debt interest £111bn 2025-26 (3.7% GDP, 8.3% of spending); 1pp gilt sensitivity ~£12bn.
ONS, Public sector finances (Oct 2025): PSND 94.5% GDP.
Bank of England Staff Working Paper No. 1019 (2023): 30-year gilt yields rose 120bp in three days post-23 Sep 2022; BoE gilt purchases £19.26bn.
Wadhwani (CEPR, Oct 2024): under a quarter of Truss-period yield rise attributable to the budget itself.
Offshore Energies UK / Offshore Technology (Nov 2025): UK production from 4.4 to 1.3 mboe/d; OEUK estimate £15.7-£48.6bn additional EPL receipts from 2026 reform.